There a lot of new volatility products which I want to review.
One of my favorite one is XIV. Bill Luby has a good discussion going on Vix and More.
The biggest risks for the XIV is a catastrophic event which creates a spike in VIX futures. In August 2011 we had several days when VIX jumped 20-50% and VXX moved up 15-20%. So XIV lost 15-20% in those days.
During the past 2 months XIV was a terrible investment (it lost 66% from the peak). Is this normal? Where there other time periods when this would have happened?
I went back and tried to recreate XIV using Juan Ramon Velasco Barros' VXX data since 2004 from his website.
I came up with a few conclusions:
- in August the VIX had a record jump of 103% in a week (unprecedented in the past 20 years)
- the worst drawdown of more than 80% in XIV would have been during 2007-2008, but it wasn't in one day
- in the 2 months after Lehman went under the XIV would have lost 75%
- the worst one day move was -20%
The chance of a 100% loss in a day seems very small, but the drawdown during a few weeks/months could be significant (70-80%).
So why would anybody invest in something like this? I will write about the upside of XIV next time.
Tuesday, September 20, 2011

Friday, April 23, 2010
Implied volatility surface and its impact on Greeks
One of the assumptions of the Black-Scholes model is that the volatility is constant for all strikes and maturities. The reality is that the implied volatility surface is not flat:
This has a significant implication on Greeks. For example, the true theta of an OTM put option is lower than estimated by the Black Scholes model. The reason is that over time the implied volatility of the out of the money put option is going up - the smile is getting bigger.
For example the SPY 2012 Dec 60 Put has an IV of 33.7%, while the 2011 Dec 60 Put has an IV of 35.4%. So over 1 year the IV goes up by 1.7%. The Black-Scholes model says that the theta is 0.0038. If we adjust for the increase in IV over time the theta drops to 0.0028 - a 30% reduction in theta.
On the other hand the IV of an ATM option is going down over time (at least based on the current IV surface), so the theta is underestimated.
To make things even more complicated, the IV surface is not static, it is changing all the time.

This has a significant implication on Greeks. For example, the true theta of an OTM put option is lower than estimated by the Black Scholes model. The reason is that over time the implied volatility of the out of the money put option is going up - the smile is getting bigger.
For example the SPY 2012 Dec 60 Put has an IV of 33.7%, while the 2011 Dec 60 Put has an IV of 35.4%. So over 1 year the IV goes up by 1.7%. The Black-Scholes model says that the theta is 0.0038. If we adjust for the increase in IV over time the theta drops to 0.0028 - a 30% reduction in theta.
On the other hand the IV of an ATM option is going down over time (at least based on the current IV surface), so the theta is underestimated.
To make things even more complicated, the IV surface is not static, it is changing all the time.
Friday, March 5, 2010
Market Review 3/5/10
Market jumped on better than expected job numbers. VIX and VIX futures fell. Even the long term VIX futures fell as the risk of a double dip recession diminished somewhat.
 If you are a net option seller risk management is extremely important in days like this.
Thursday, March 4, 2010
Market Review 3/4/10
Another relatively quiet day in the market. VIX is down to 18.7, the April VIX futures continued to fall.
Wall Street Journal had an article today about VIX being low.
There are a few reasons for the VIX to be this low:
-the realized volatility for the S&P over the past month is 11.6%. For the past 3 months it is 14.8%.
-the Greek credit crisis is easing. The CDS on Greece dropped below 300 bps yesterday (from the high of 420 bps)
-relatively positive economic news from US
-the market is up sharply from February lows
On the other side, the biggest argument against a low VIX is the high yield OAS. Early January when the VIX was below 20, the high yield OAS was around 5.9%. Yesterday the OAS was 6.4%. So the OAS has to come down or the VIX has to go up.
Tomorrow's job report could be a turning point.
Wall Street Journal had an article today about VIX being low.
There are a few reasons for the VIX to be this low:
-the realized volatility for the S&P over the past month is 11.6%. For the past 3 months it is 14.8%.
-the Greek credit crisis is easing. The CDS on Greece dropped below 300 bps yesterday (from the high of 420 bps)
-relatively positive economic news from US
-the market is up sharply from February lows
On the other side, the biggest argument against a low VIX is the high yield OAS. Early January when the VIX was below 20, the high yield OAS was around 5.9%. Yesterday the OAS was 6.4%. So the OAS has to come down or the VIX has to go up.
Tomorrow's job report could be a turning point.
Wednesday, March 3, 2010
Market Review 3/3/10
Even though the equity market was flat today, the VIX futures continued to fall. The Mar VIX futures fell to 19.6 while the Apr VIX futures fell to 22.55.
There was a significant VIX put option spread trade this morning. 45,000 Mar 20 put options were sold for $1.33 and 45,000 Apr 20 put options were bought for $0.83. This is a similar trade I mentioned last Friday, being neutral-long Mar VIX and short Apr VIX. So far this trade was profitable this week as the spread between the two narrowed.
Over the past year, at the VIX option expiration the median spread between the near month and next month futures was around 200 bps. The current spread is 295 bps, down from 310 last Friday.
Due to better economic news and ease of the Greek debt crisis the long term VIX fell this week. The high yield OAS fell as well but not as much as the VIX, so the drop in VIX could be overdone in the short term.
If you are short short-term volatility (short Mar VIX calls) it is probably a good time to lock-in your gains.
There was a significant VIX put option spread trade this morning. 45,000 Mar 20 put options were sold for $1.33 and 45,000 Apr 20 put options were bought for $0.83. This is a similar trade I mentioned last Friday, being neutral-long Mar VIX and short Apr VIX. So far this trade was profitable this week as the spread between the two narrowed.
Over the past year, at the VIX option expiration the median spread between the near month and next month futures was around 200 bps. The current spread is 295 bps, down from 310 last Friday.
Due to better economic news and ease of the Greek debt crisis the long term VIX fell this week. The high yield OAS fell as well but not as much as the VIX, so the drop in VIX could be overdone in the short term.
If you are short short-term volatility (short Mar VIX calls) it is probably a good time to lock-in your gains.
Tuesday, March 2, 2010
Market Review 3/2/2010
The S&P 500 was up 0.23% today and the VIX went down to 19.06%.
The spread between the April VIX futures and March VIX futures continued to narrow. See my earlier post.
Over the past month the volume of VIX options reached 5 million:
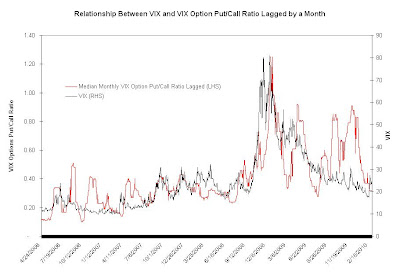
 Yesterday the VIX put option volume reached 166,000. The put/call ratio for VIX options was around 1, which is significantly higher the the long term average of 0.52.
Interestingly the VIX option put/call ratio lags the VIX by about a month:
Monday, March 1, 2010
Market Review 3/1/10
The S&P was up 1% today, VIX was down to 19.26, VIX futures came down as well. The April VIX futures went from 23.5 to 23. On Friday I argued the the VIX futures term struture is too steep. Today the April VIX fell more than the Mar VIX lowering the spread between the two.
There was some notable volume in the Mar 20 and Apr 20 VIX put options. Benzinga reported a large (25,000) March 20 straddle trade as well.
There was some notable volume in the Mar 20 and Apr 20 VIX put options. Benzinga reported a large (25,000) March 20 straddle trade as well.
Interestingly the implied volatility in the Mar VIX put options increased over the past few days while the Apr put and call options implied volatility was relatively stable.
For example, the Mar 22.5 put options IV increased from 81% to 90%, while the April 22.5 puts IV stayed at 64%.
For example, the Mar 22.5 put options IV increased from 81% to 90%, while the April 22.5 puts IV stayed at 64%.
Subscribe to:
Posts (Atom)

 Posts
Posts

